
Velocity is a vector
A vector is an entity that has both magnitude (size) and direction. Velocity indicates the speed of something in a particular direction.
In physics, velocity is the rate at which an object changes its position. An object that oscillates at a high speed, but always returns to its starting position has a zero velocity.
Velocity is the rate at which a team delivers value to the customer. A team that completes lots of tasks, but delivers no value to the customer should have a zero velocity.
In agile software development, velocity is the rate at which a team delivers value to the customer. Value is quantifiable, and we can therefore say it has size. The direction is indicated by the traversal from idea to implementation. A team that completes lots of tasks, but delivers no value to the customer should have a zero velocity.
I say “should” because I see an awful lot of teams that measure velocity based on criteria other than value to the customer. Some consider a story done when development is complete. Others are a tad more “mature” and count a story as done when it is ready to go to production. Not actually in production, mind you; that takes weeks - what with manual testing requirements and change control procedures and getting into queue for the operations team... And some teams consider a story complete once it is actually in production. But even that assumes value to the customer. What if you didn’t count a story as done until customers were actually using it and liked it? If velocity is the rate at which we deliver value to the customer, wouldn’t a true measure of velocity include verification of value delivery?
But I digress a bit, perhaps.
Let’s go with “in production” means done. We won’t get into details of how to deliver at the end of each iteration, much less continuous delivery. That’s a topic for another time.
Velocity is a lagging indicator
Velocity is also a lagging indicator. It is a measure taken at the end of a series of steps. We plan, we prioritize, we work, we test, and then we measure.
Lagging indicators are abstract
Lagging indicators tend to be aggregate or abstract. They don’t provide detailed insight into the operations, rather they provide an indication of results. Net profit is a lagging indicator for a company. While it tells us about how the company is doing, it gives us no indication of why the organization was or was not successful.
Let’s look at another lagging indicator; unemployment. The unemployment index is a lagging indicator. It tells us whether or not unemployment is on the rise or decline, which in turns tells us if the economy is doing poorly or well, respectively. An increase in unemployment means a sagging economy. A decrease in unemployment means a growing economy. But there is nothing about unemployment that tells us why the economy is performing in a particular manner or how we might go about making an adjustment to economic policy to bolster growth. Moreover, the way to bolster the economy is not to focus on unemployment, but to address the underlying issues.
Historically, policies focused on training and jobs creation have had little or even negative impact on employment among the populations the programs target. Those that did create new jobs, such as the Works Progress Administration of the 1930s and the Public Employment Program of the 1970s and 1980s, did little to impact generation of jobs outside of those directly created and funded by the programs. Essentially, these created an artificial drop in unemployment, but did not address underlying causes. Each program resulted in a corresponding increase in unemployment once government funding ran out.
Whereas, policies focused on addressing broader monetary and fiscal trends can result in a boost in Aggregate Demand, which then leads to a decrease in unemployment.
Similarly, one of the problems with velocity as a lagging indicator is that while it can tell how much work we delivered over a given time period, it cannot tell how well the team is doing at ensuring consistent delivery or at improving their process overall. For some teams, velocity may be an indicator of team health or at least capability, but it provides no insight into root causes. Moreover, attempts to increase velocity directly tend to either create artificial increases that are not sustainable or result in other more detrimental issues. Whereas, efforts to address underlying causes more often than not result in improvements in velocity. Managing story composition and limiting work in process results in smoother flow, which leads to a more stable velocity and the ability for a team to mature into more rapid delivery.
A stable or slightly increasing velocity is usually considered a good thing. When managers see a stable velocity from iteration to iteration, they may become complacent and forgo any improvement efforts. But the reality is that there are actually numerous factors that impact a team’s ability to deliver and the current velocity trend may be more a matter of coincidence than performance. We will look at a number of factors that impact velocity in later sections.
Lagging Indicators are poor short-term predictors
Lagging indicators tend to be weak indicators for the short-term and are much more reliable for confirming long-term trends.
Let’s take a look at “velocity” in a different industry.
For retail, we can use sales volume as our “velocity”. Sales volume is a lagging indicator which tells us something about how we did in the prior period, but does not give us any indication as to why sales was high or low.
The following shows 10 years of retail sales for a narrow set of products.
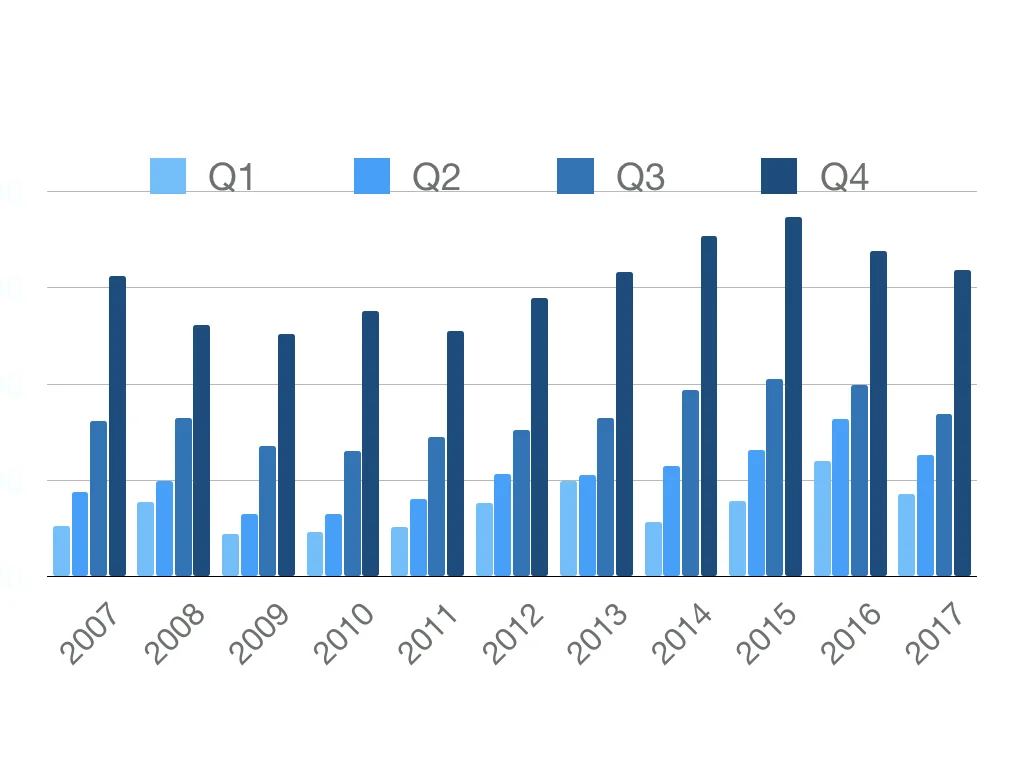
Retail Sales Volume by Period
From this graph, we can discern some patterns. We know Q4 sales are consistently higher than the others. And we know that Q1 sales are normally the lowest at approximately 75% of the prior Q4. We can also see that the sales from the prior quarter is often not a good indicator of what the next quarter’s sales will be. Sure, we can look at the long history and determine average percentages and apply that to get a fairly good guess. But we need the long history. Looking at only the prior quarter’s sales is insufficient for determining the next quarter’s sales.
Similarly, our velocity from the immediately concluded iteration is not often a good indicator of what the velocity will be in the next iteration. From one iteration to the next, velocity can vary wildly due to any number of factors.
But, like retail sales, we can look at velocity over time and confirm trends we might suspect, such as a lower average velocity during holiday seasons. This doesn’t tell us what the velocity will be in November or December, but it does let us know that the odds are good these months will have lower velocity numbers than September or October.
Velocity is a measure of a complex system
This is ultimately quite significant. Velocity, while a simple concept, is actually a measure of output for a complex system. Think about the number of factors that go into a velocity measurement. There is the organizational mission, the broader business objectives, and the objective of the product itself. There are product owners, designers, architects, developers, testers, subject matter experts, security specialists, database specialists, governance, and production specialists involved. There are stand-ups, planning meetings, and retrospectives. There are epics, stories, and tasks all tracked on a board or in a system with multiple lanes representing different key states in the delivery of each single piece of work. After all these individuals interact with one another, responding to change, and collaborating with the customer in pursuit of working software, we take a single measurement. That single measurement represents the interactions of the individuals and all of their adaptions to change in the delivery of working software.
Velocity is a simple measure of a very complex system.
To measure creative work by throughput alone is to not measure it at all; quality and impact are essential.
While a simple measure of a complex system may sound ideal, in this case, it is generally insufficient. Velocity doesn’t tell us enough to be particularly useful. From velocity alone one cannot ferret out root causes. On cannot determine conclusively that the team is doing better (or worse) from a rising (or falling) velocity.
Velocity is but one dimension to consider. To measure creative work by throughput alone is to not measure it at all; quality and impact are essential.
This article is an excerpt from the book, “Escape Velocity”, available on LeanPub, Amazon, and elsewhere.